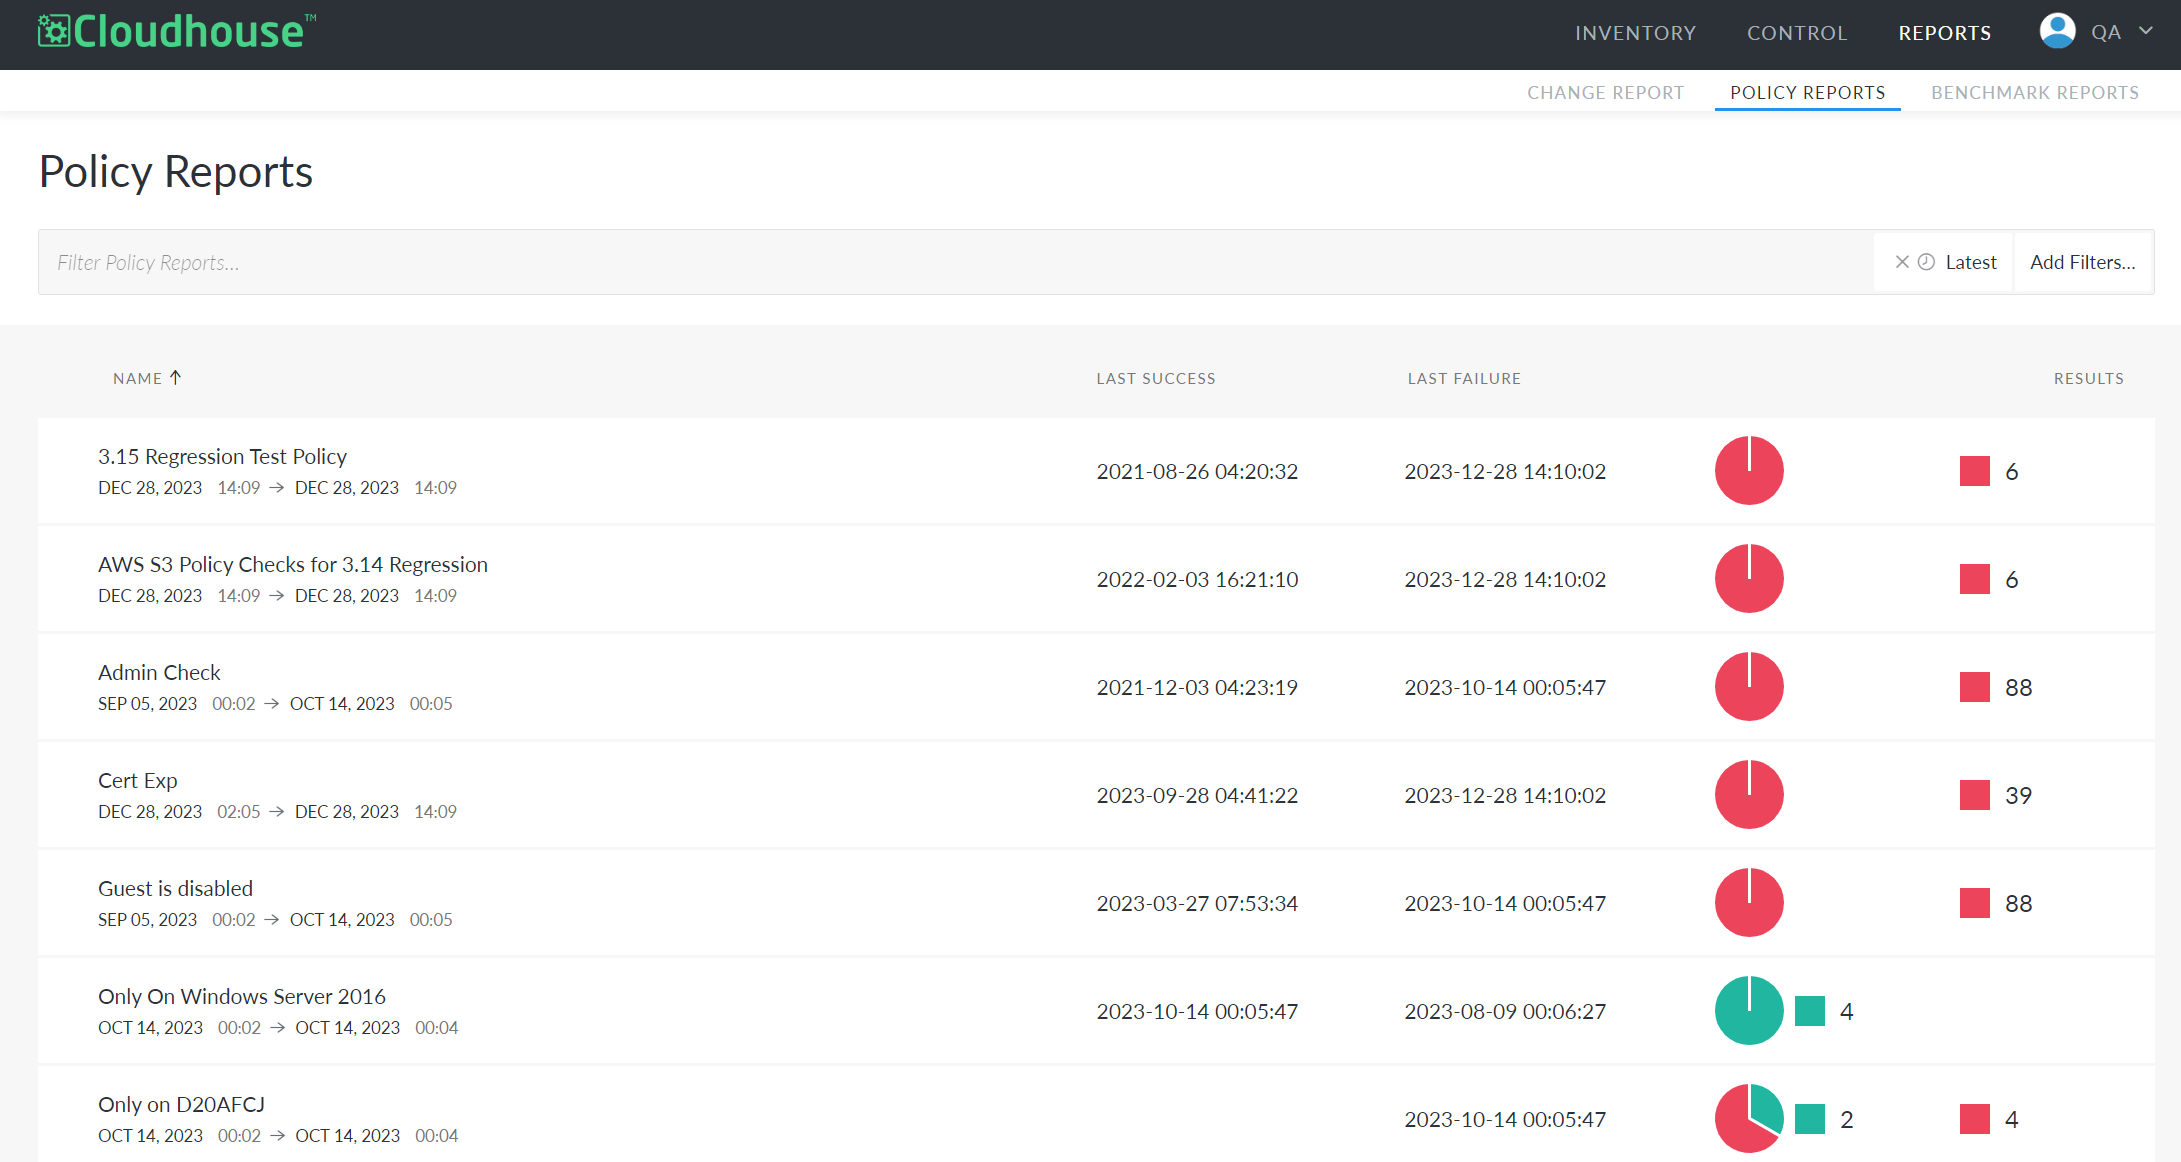
The Policy Reports tab (Reports > Policy Reports) displays the results of all existing policies that are applied to at least one node group. In Cloudhouse Guardian (Guardian), a policy is a set of configurations you expect nodes to meet. Policies can be applied to node groups to assess their compliance with the configurations the policy defines, and the results can be viewed in a policy report. Here, you'll find an overview for each policy report, including a breakdown of the number of results in the following categories:
|
Category |
Description |
|---|---|
| Passing |
Indicates that a node has met all requirements for a given check. |
| Failing |
Indicates that a node did not pass a given check. |
| Error |
Indicates a permissions issue on the node being scanned. |
Keep in mind that, after setting up a new policy, results will be shown after the next node scan. For more information on policies, see Policies.
Note: By default, the Policy Reports tab shows reports that have results within the last week. If you don't see any reports, or if you can't find the report you're looking for, try updating the filters at the top of the page. For more information, see Filter Results.
Access a Report
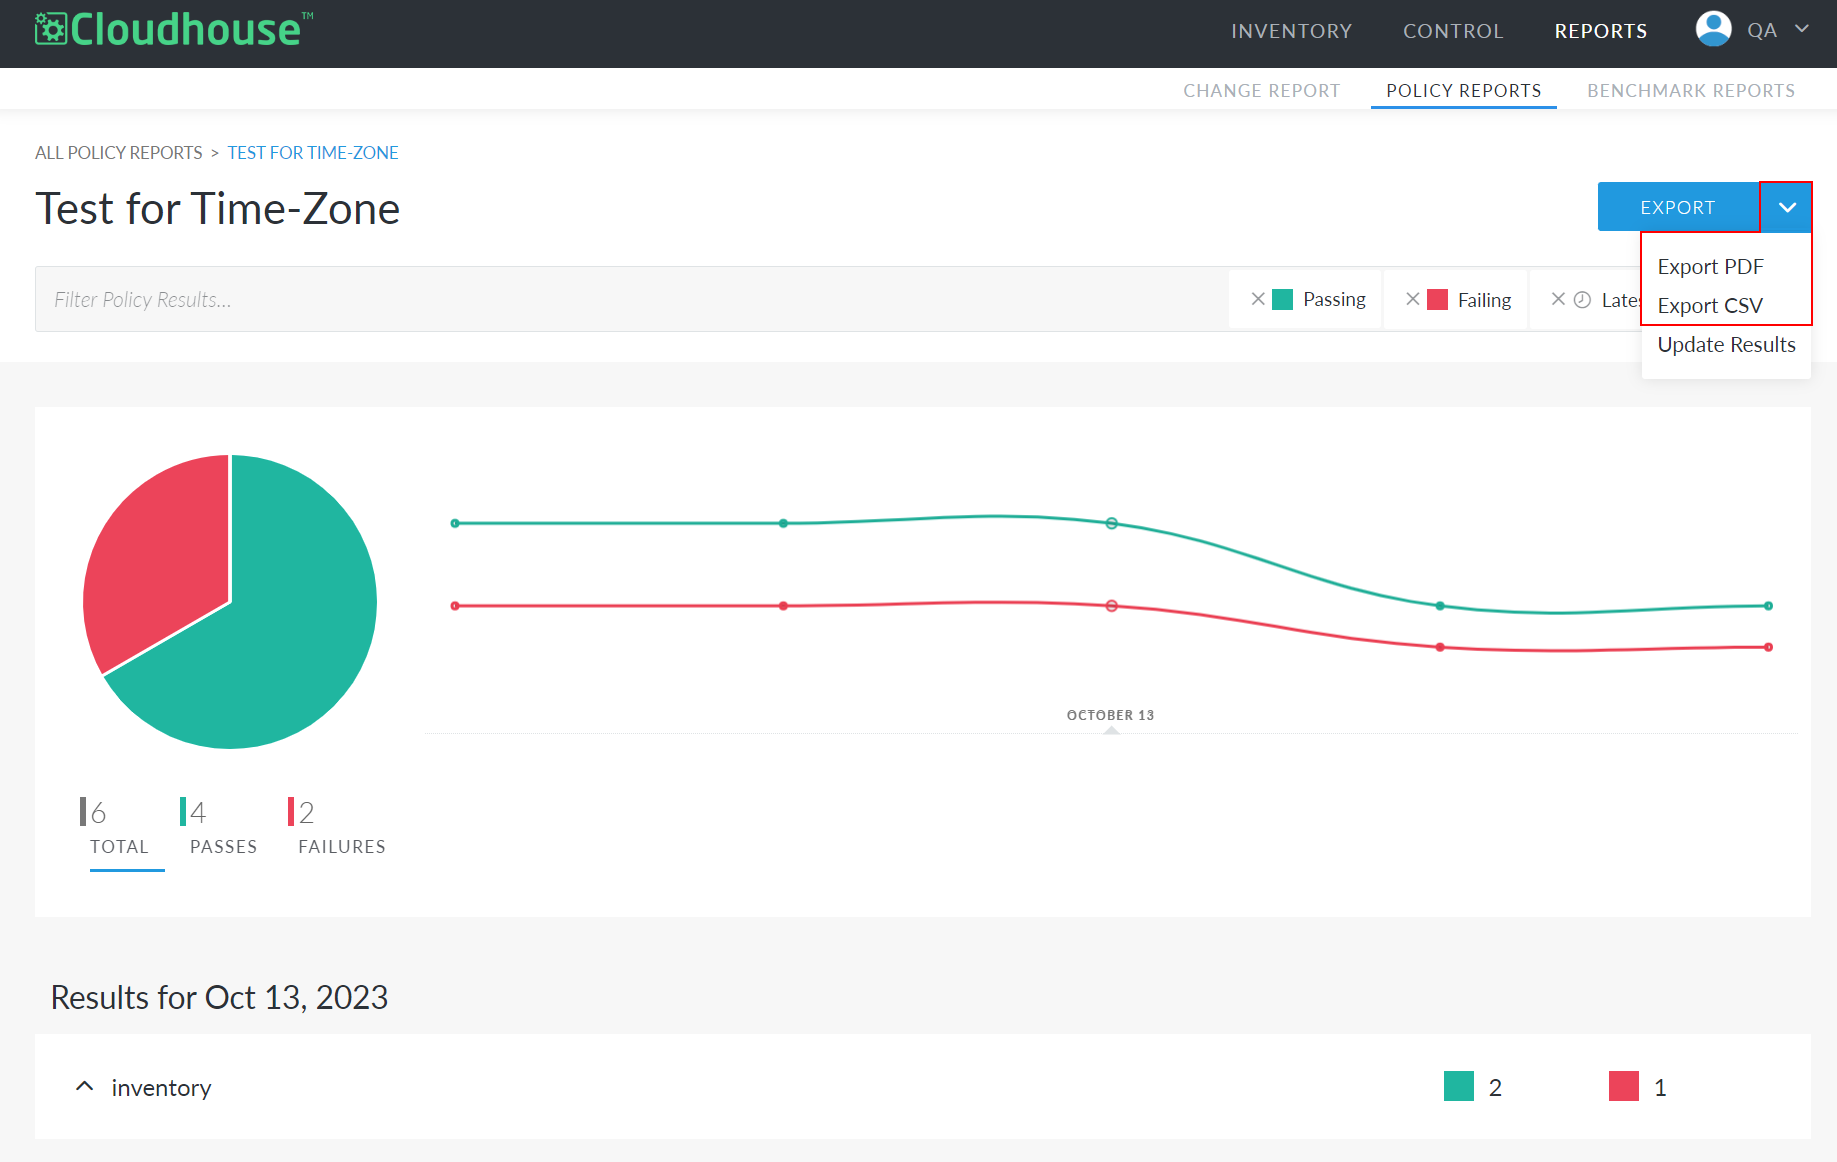
From the Policy Reports tab, you can access a detailed view of a report. To access the detailed view of a report, click that report's overview. This displays the detailed results for that report, including a pie chart that breaks down the ratio of 'Passing' and 'Failing' results. This page also includes a graph that shows changes in the results over time. The time covered in this graph is set by the filters you have applied to the report. For more information, see Filter Results. To view results for a specific date, find that date on the graph and click it. This updates the rest of the page to display results for that date.
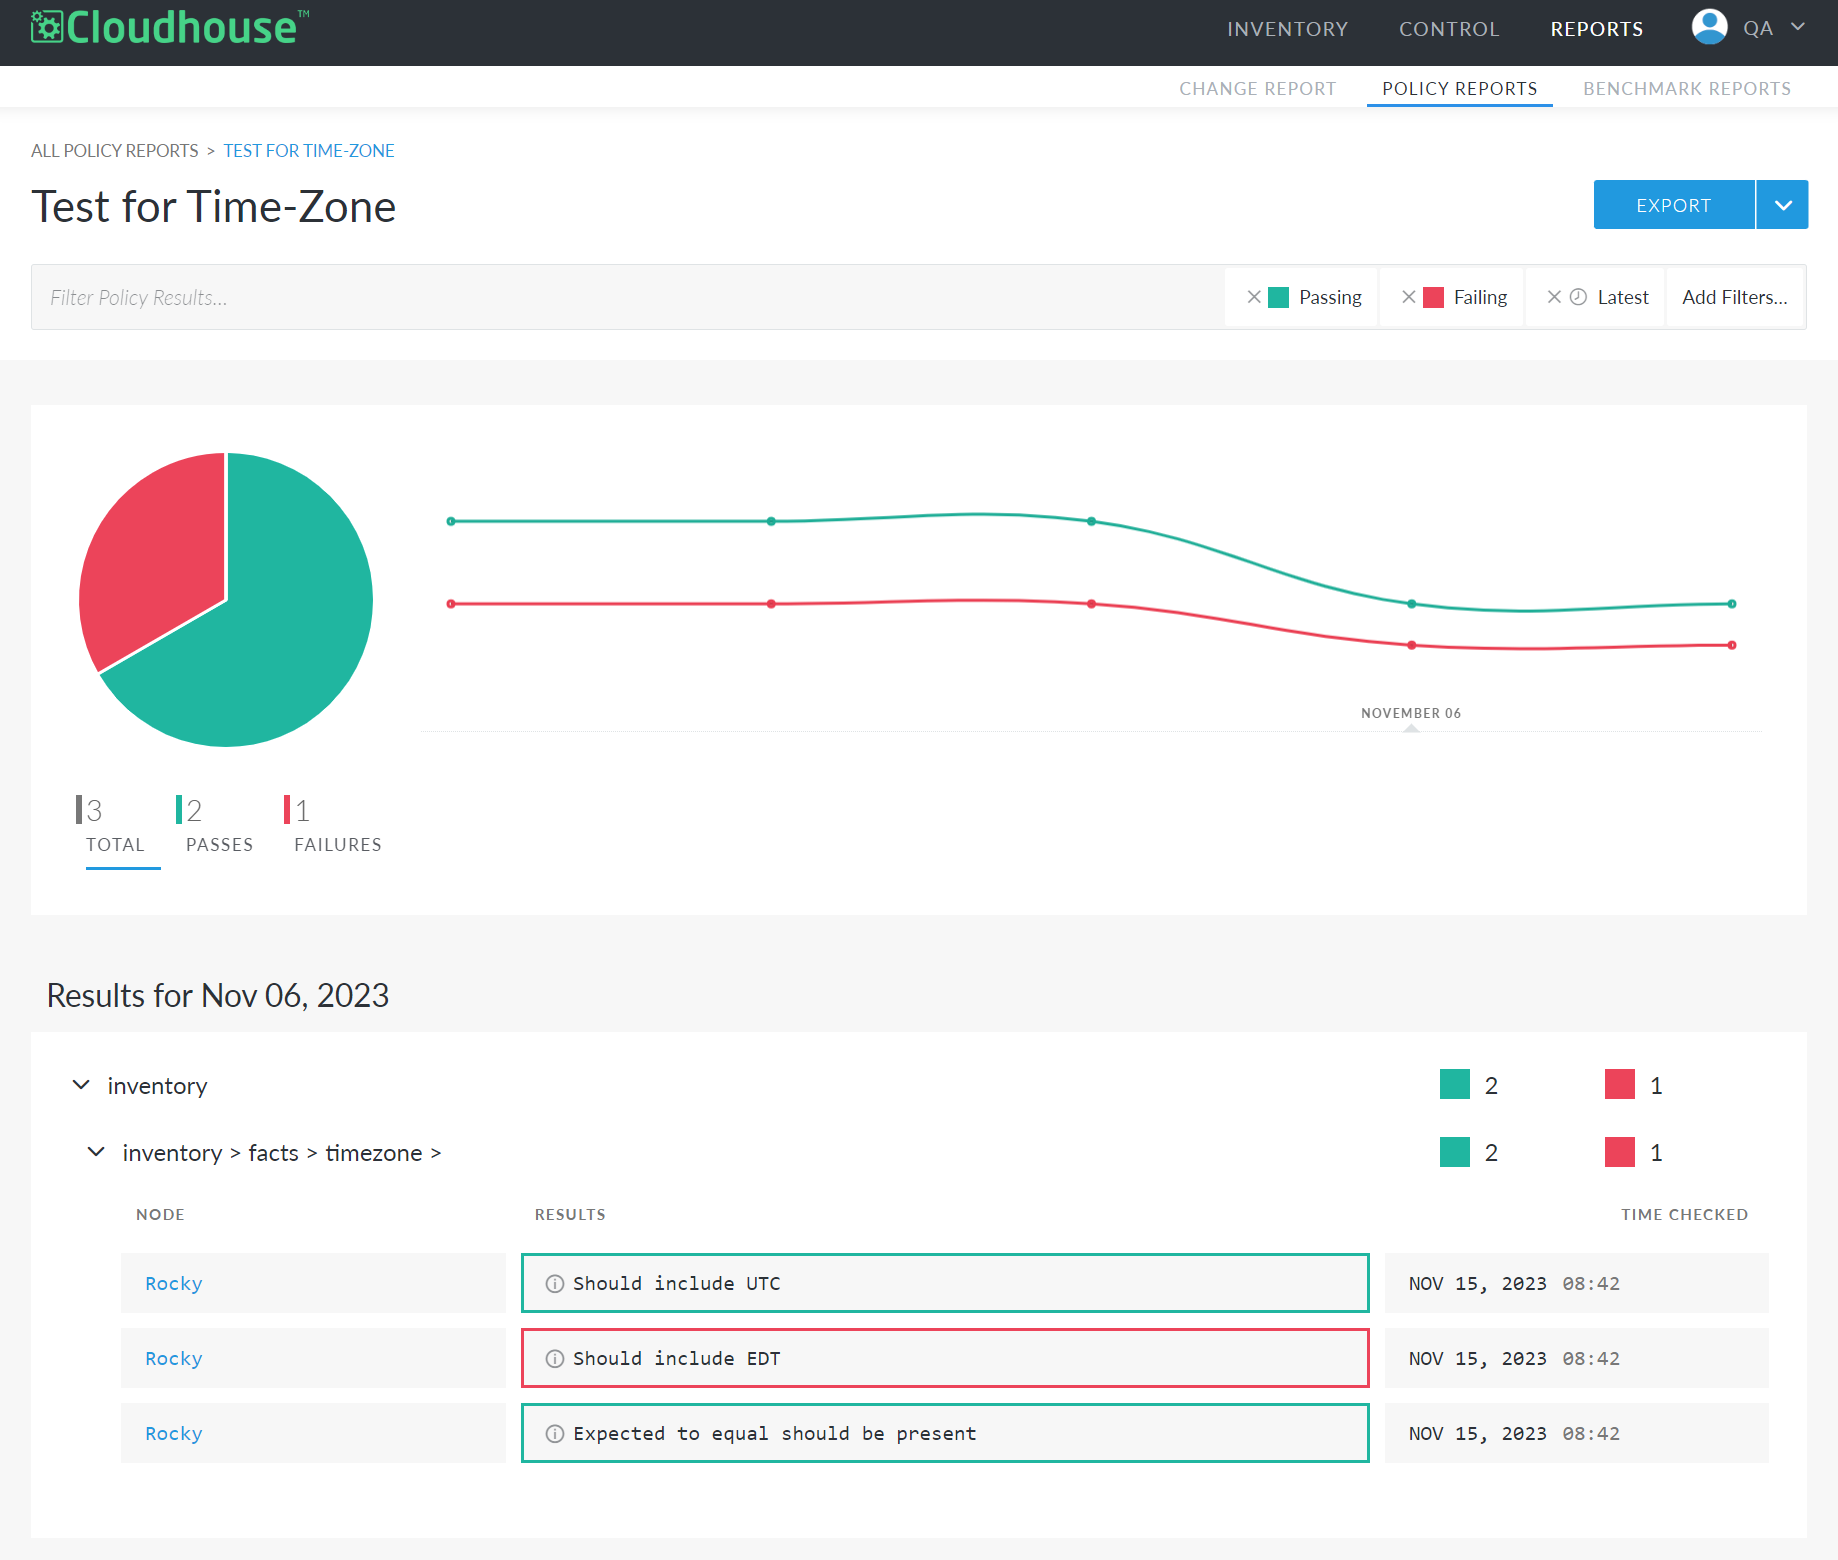
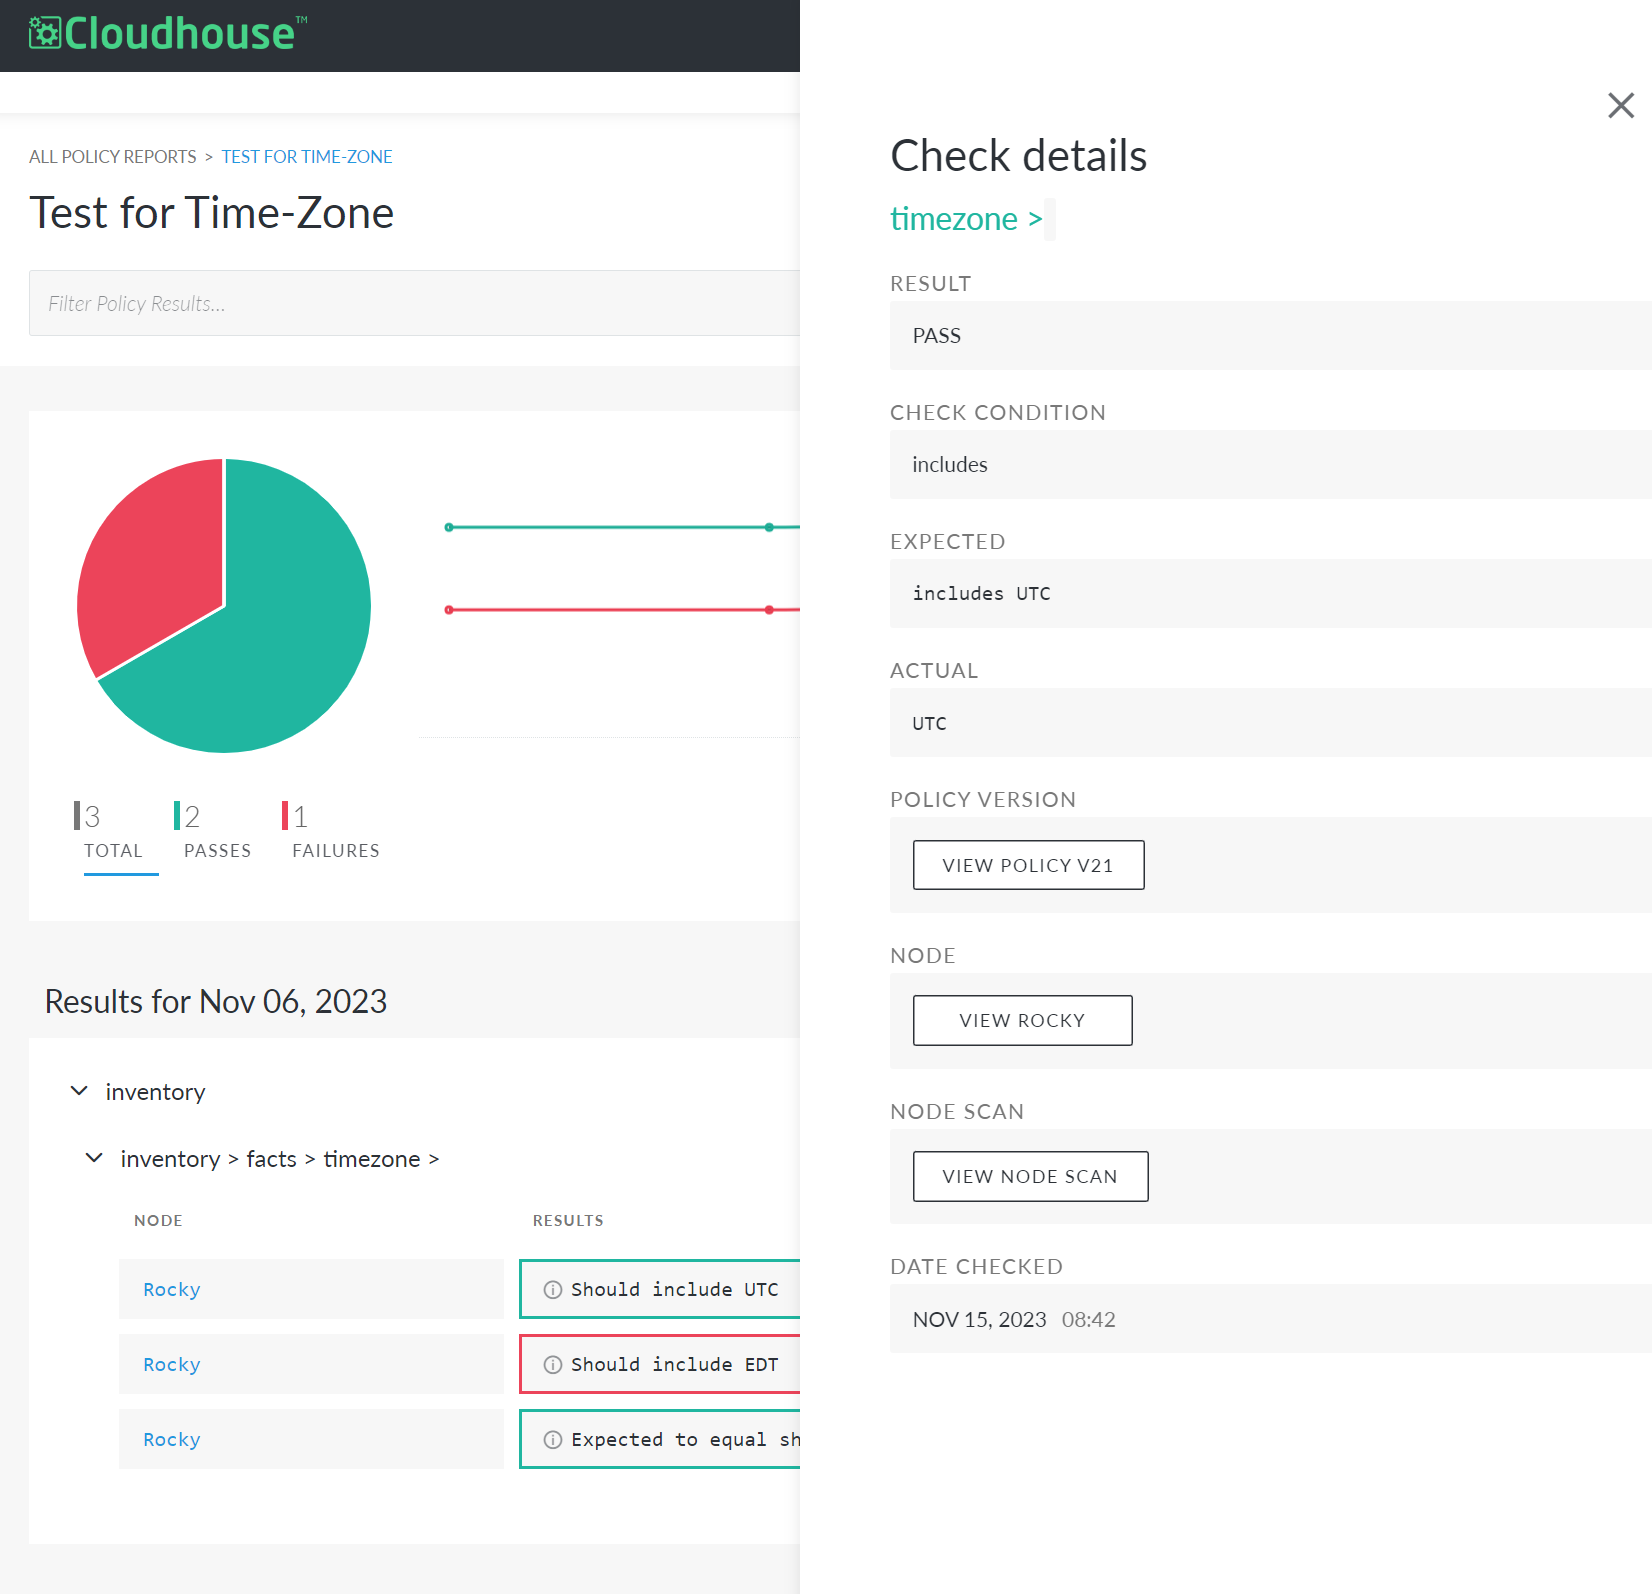
Policies are made up of several different metrics, more commonly called checks, that determine whether a node is compliant with the requirements set by that policy. A policy report displays each check along with the results for each node the policy was run against. To view more information on a specific check, click the check to open a drop-down displaying more details. From there, you can also view more information on the results for a specific node. To view detailed results for a specific node, click the Results column for that node. This opens a side panel displaying information on what the check is looking for, a link to the policy, and links to the respective node and node scan.
Filter Results
When viewing a report, you have several filters that can be applied to customize the data displayed. To apply filters to a report, click Add Filters in the top right corner of the page. This opens a drop-down where you can select which filters you'd like to apply.
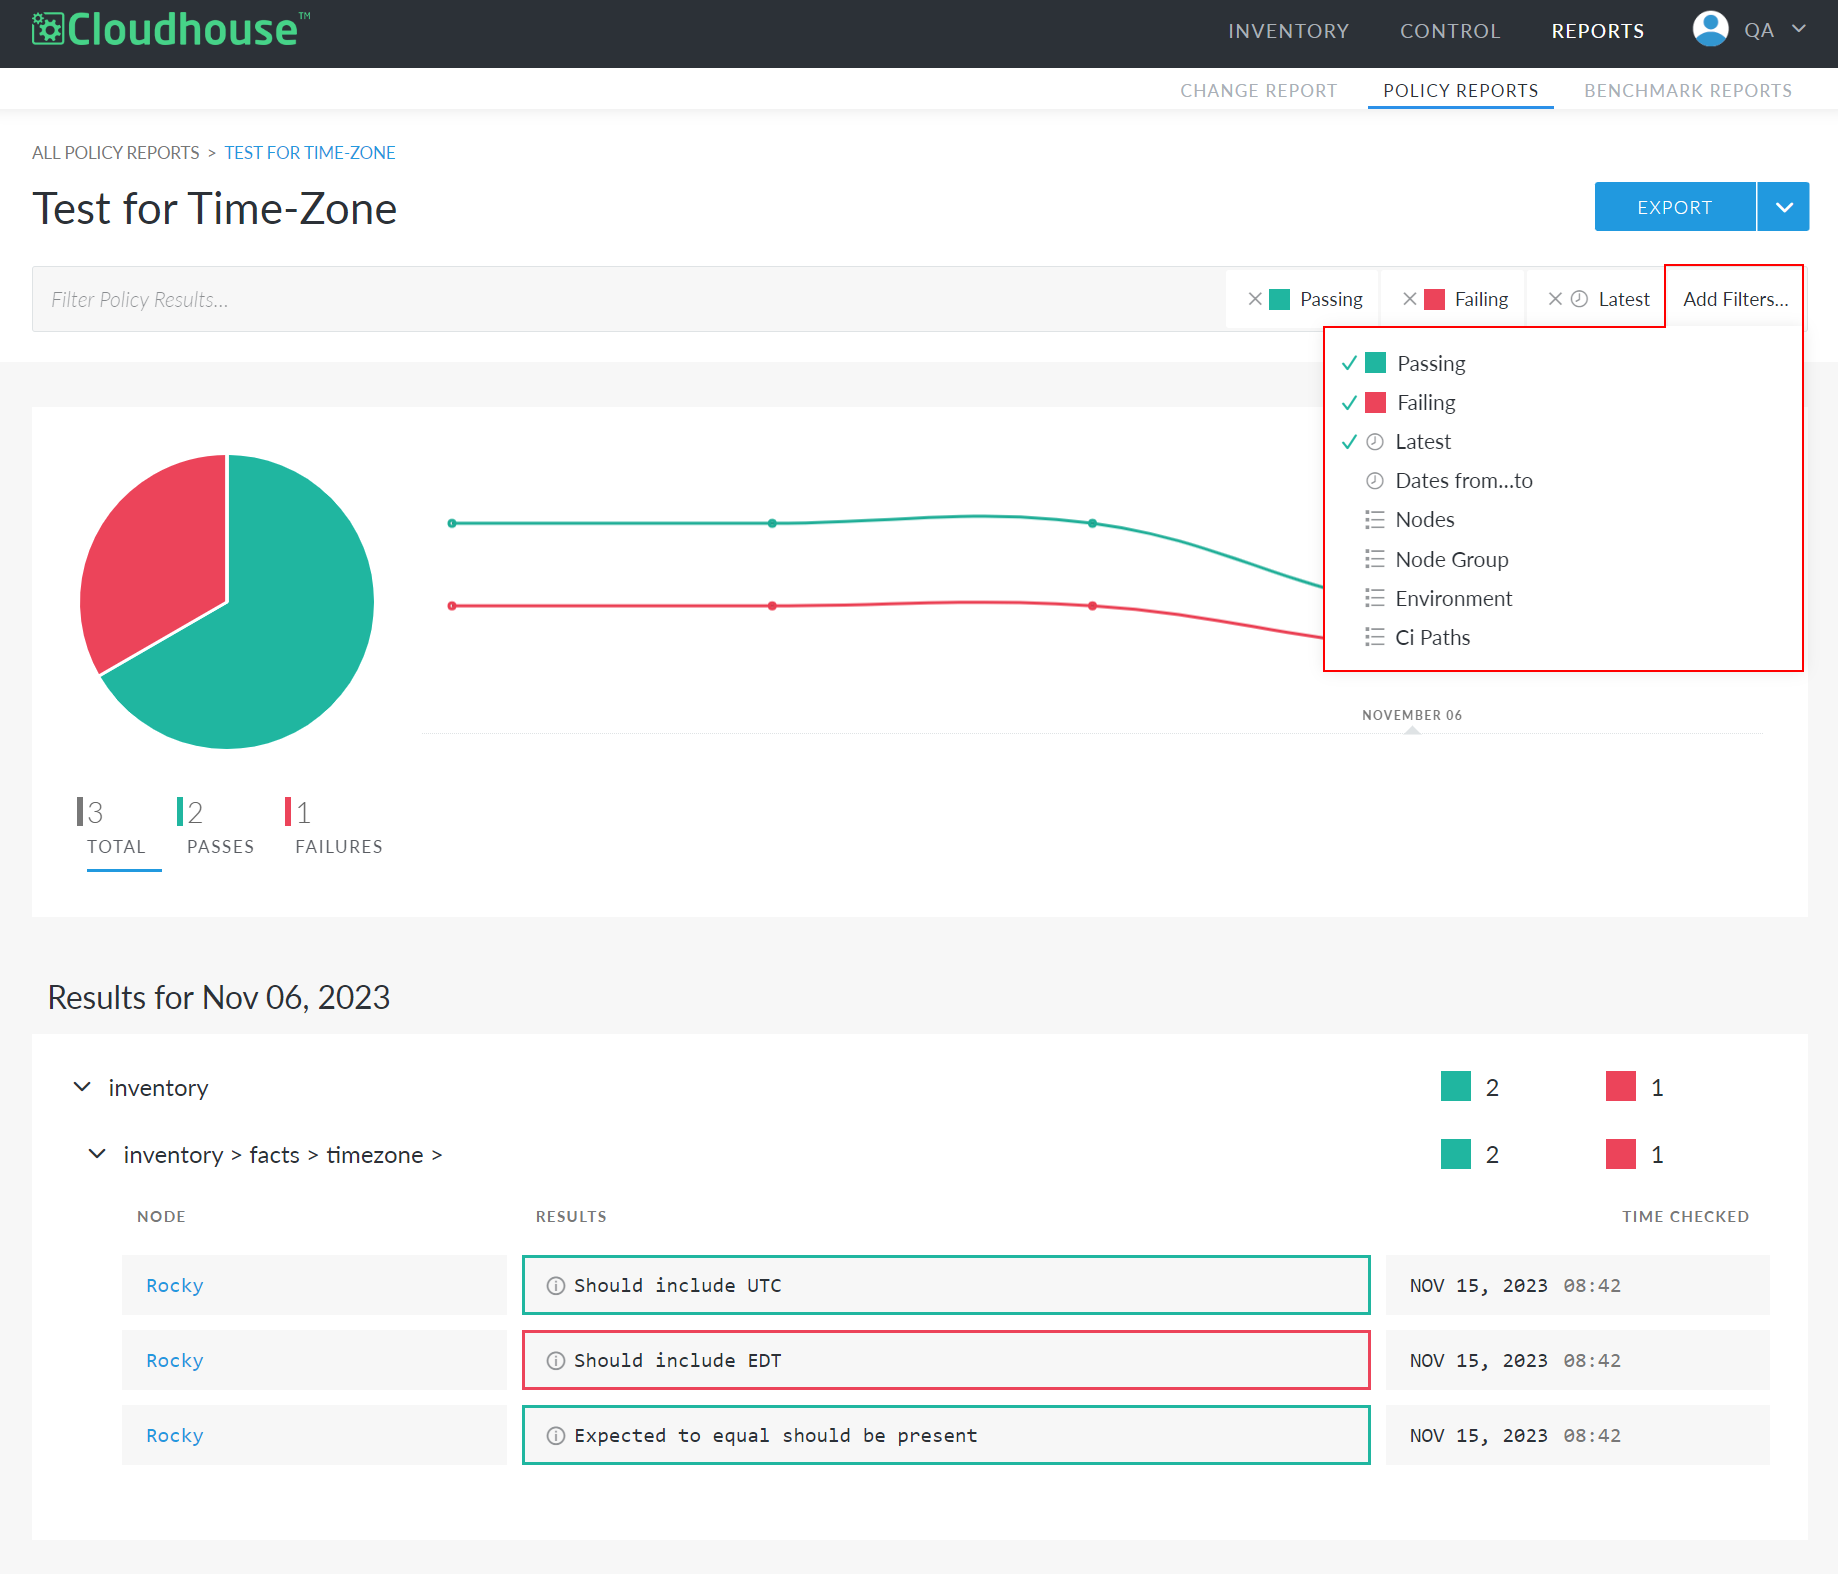
Here, the following options are displayed:
| Filter | Description |
|---|---|
| Passing |
Designates whether 'Passing' results are displayed in the report. If applied, 'Passing' results are displayed. If not applied, 'Passing' results are not displayed. A Passing result indicates that a node has met all requirements for a given check. |
| Failing |
Designates whether 'Failing' results are displayed in the report. If applied, 'Failing' results are displayed. If not applied, 'Failing' results are not displayed. A Failing result indicates that a node did not pass a given check. A node might fail a check for various reasons. To view specific details including the failing node and how to address it, find the failed check in the report and click Show check results. |
| Latest |
Designates whether only the results of the latest successful scan are displayed in the report. If applied, only the results of the latest scan are displayed in the report. If not applied, the Dates from...to filter is automatically applied which allows you to stipulate an exact time frame for policy report date. By default, this option is applied if the Latest filter was applied on the previous page. If the Latest filter was not applied on the previous page, this option is not automatically applied. Note: If both the Latest and Dates from...to filter are applied, only the latest scan that falls within the specified range of dates is displayed. |
| Dates from...to |
Designates the range of dates for which data is displayed. To set a date range, first select the filter from the Add Filters drop-down. If the report occurred over more than one day, two calendars are displayed with the available reporting dates in blue. Select a start and end date from the available date range. If not applied, the Latest filter is automatically applied, and only the results of the latest successful scan are displayed. By default, this option is applied if the Dates from...to filter was applied on the previous page. If the Latest filter was not applied on the previous page, this option is not automatically applied. Note: If both the Latest and Dates from...to filter are applied, only the latest scan that falls within the specified range of dates is displayed. |
| Nodes |
Designates which node(s) to display policy report data on. If applied, this filter displays a drop-down menu with the list of nodes available to report on. From the drop-down, select the node(s) you wish to display in the report. If not applied, data for all nodes run against this policy is displayed. Note: Only nodes from the node group(s) run against this policy are displayed in the Nodes filter. If you don't see a specific node, it's possible it has not yet been scanned by this policy. |
| Node Group |
Designates which node group(s) to display policy report data on. If applied, this filter provides a drop-down menu displaying available node groups for this report. From the drop-down, select the node group(s) you wish to display in the report. If not applied, data for all node groups run against this policy is displayed. Note: Only node groups run against this policy are displayed in applying the Node Groups filter. If you don't see a specific node group, it's possible it has not yet been scanned by this policy. |
| Environment | Designates which environment(s) to display policy report data on. If applied, this filter provides a drop-down menu displaying available environments for this report. From the drop-down, select the environment(s) you wish to display in the report. If not applied, data for all environments run against this policy is displayed. |
| Ci Paths |
Designates a specific check or set of checks for which data is displayed. A Configuration Item ("CI") path is a list of key names used to identify specific attributes in node scan data. If applied, this filter provides a drop-down menu displaying available configuration items (or checks) for this report. From the drop-down, select the check(s) you wish to display in the report. If not applied, results for all checks in this policy are displayed. Note: In addition to finding a specific check using the Ci Paths filter, you can also search for a check directly using the search bar at the top of the page. |
To clear a filter once it has been applied, click the X on that filter to remove it.
Export a Report
If you want to share a report with someone who is not a Guardian user, you can do so by exporting the report. Reports can be exported in either a CSV or PDF file format.
Note: To quickly export a report as a PDF, click Export in the top right corner of the page. To choose a file format while exporting, follow the steps below.
To export a report, complete the following process:
-
Click the drop-down arrow in the top right corner of the page.
-
Select to Export PDF or Export CSV.
Once you've selected a file format, you can find the report wherever your device stores downloads.